Many books and websites explain the many candle patterns and signals used by traders from day to day. Rather than repeat these explanations, this article examines the rationale for using candle patterns and signals.
Why are candles so important?
The first and most important point is that candles display price action, which reflects the market’s psychology. A trader can understand what other traders think by looking at the outcome of each day’s trading as each candle represents it. For instance, if a candle’s open and closing price is at the same level (right), there is said to be indecision, meaning that neither the traders wanting to sell nor the traders wanting to buy are in control of the day’s price action. The longer the wicks (legs or shadows), the more comprehensive the trading range.
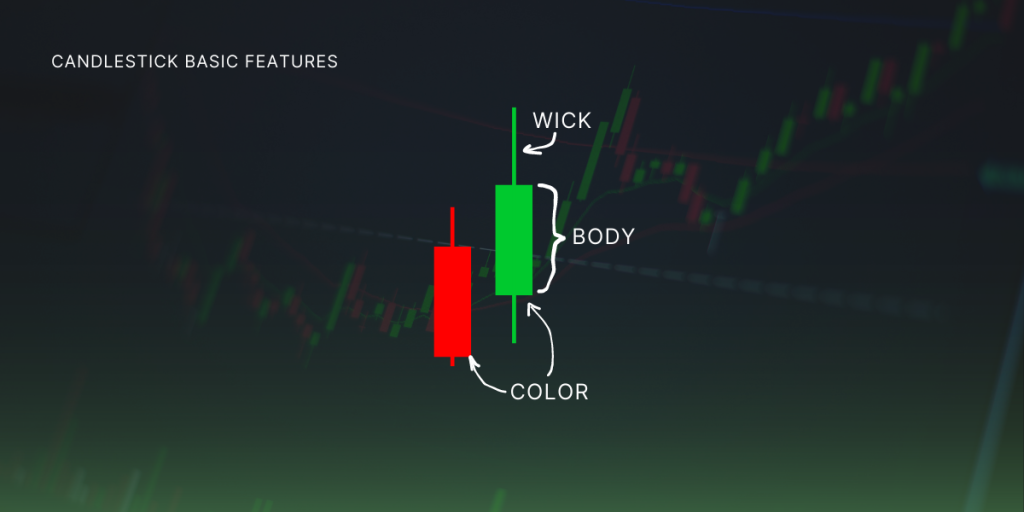
What Red Body Candles can tell you about
The red body candle shows the closing price below the opening price, suggesting that the sellers controlled this day’s trading. Compare this to the next candle (left). If we see a series of candles with red bodies, we conclude that the bears are in control and the stock is a downtrend. This type of analysis is the basis for all shapes of candles.
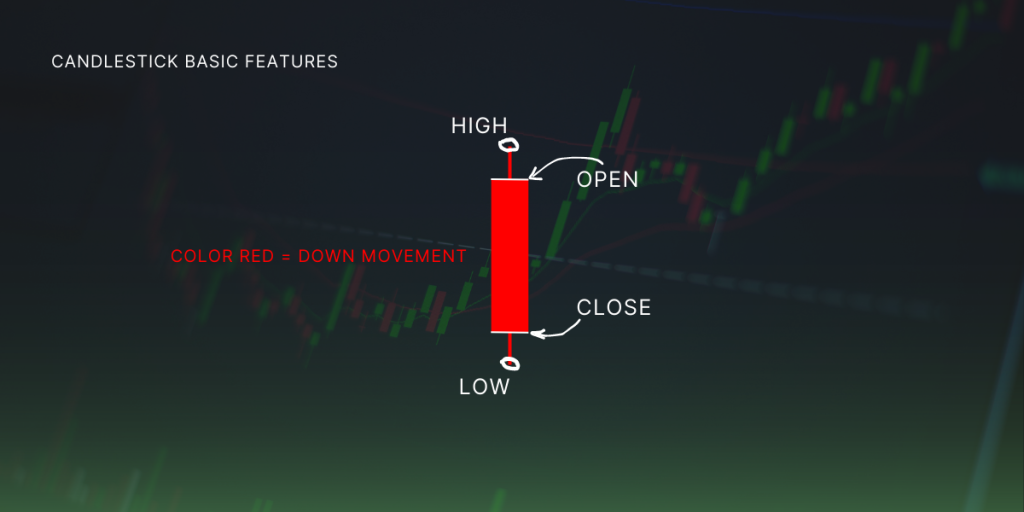
Looking at the candle on the right, you can see that both the open and close are near the top of the price range for the day. The candlestick is small, with a significant difference between its low and closing points. It indicates that the bears dominated the market most of the day, causing the price to drop. However, the bulls regained control towards the end of the day and drove the price up. However, despite this upward trend, the price closed below its opening value. The bulls are in control but lack the conviction to lower the price. Therefore, the bulls were sufficiently motivated to keep the price near the day high.
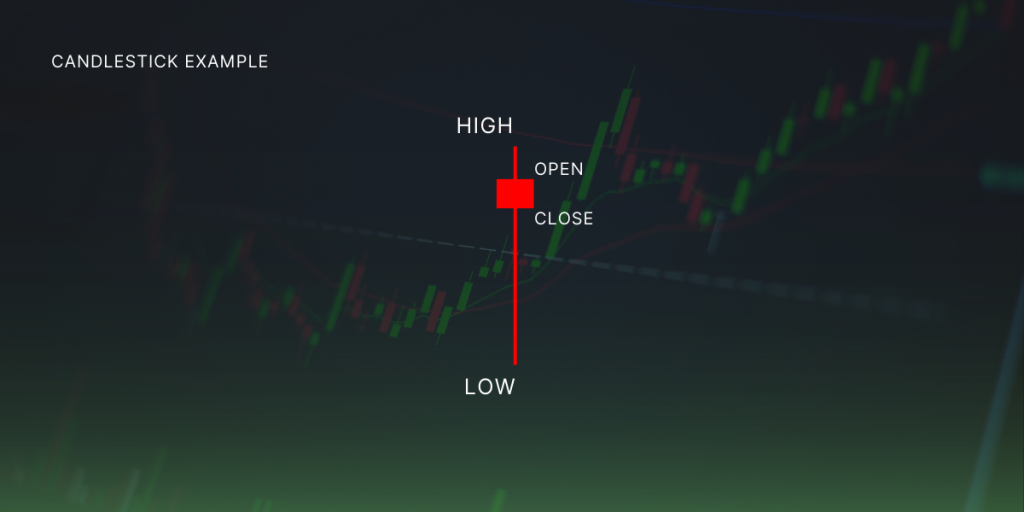
What Green Body Candles can tell you about
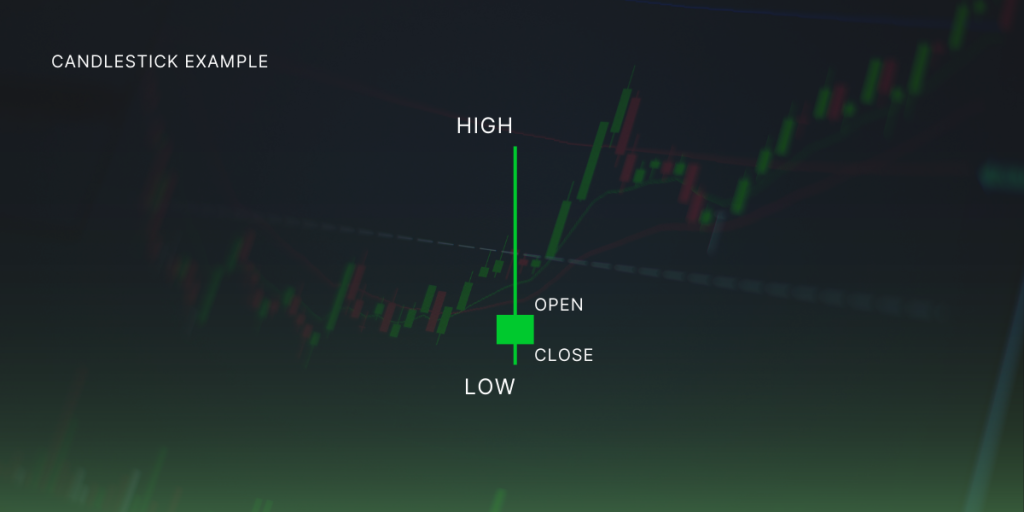
In the following example, the open is below the close, meaning the day was an up day, but the bulls lacked conviction and failed to push the price higher. The price did trade to the high at some point during the day, but the bears managed to push the price down to close near the open.
As mentioned earlier, this article aims to raise awareness that it is possible to interpret price action by reading candles (or bars). There are too many candle types to go over them all here. However, the underlying analysis is relatively consistent. With some practice, it is possible to read the market action on daily, weekly or monthly charts. Are these patterns predictive? That depends on who you listen to.
At Market Alert Pro, we conducted backtests using a bullish engulfing candle pattern as a trade entry signal and a bearish engulfing pattern as a sell signal, along with money management rules, including trade size limits and survivor bias rules. Survivor bias ensures that delisted stocks are included in the testing.
Identifying a Pattern: Green vs Red Candles
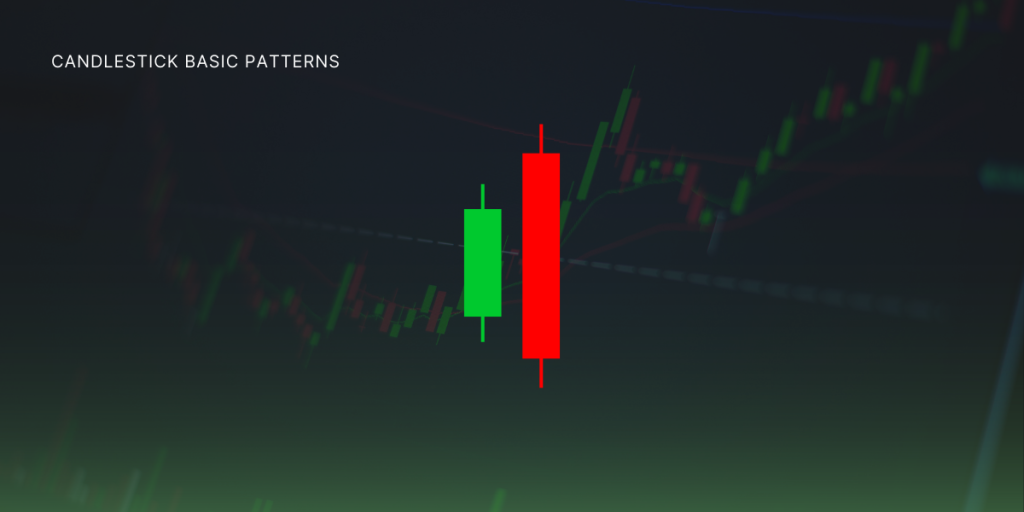
Our results indicated that these two signals effectively returned profit results that outperformed the index (S&P 500) over ten years. The candle pattern is shown in the image right. Based on the results of our testing, we believe there is merit in using this candle pattern as a trade signal.

Notice the green candle engulfs the red candle (right). When this pattern is found, the probability of an upturn in price increases. This is enhanced when the pattern is located at the bottom of a downtrend or series of lower prices. The psychology of the pattern is that the bulls are firmly in control and have pushed the price above yesterday’s price action. The price has closed near the high. The bearish engulfing pattern is the opposite configuration (below left).
Remember that no one piece of information should be taken as a trading signal. Our research included rules to establish that stocks were in an uptrend prior to trade entry and in a previous downtrend to trade exit. The engulfing patterns were one part of the strategy. That said, the strategy returned approximately a 70/30 win-loss ratio, indicating merit in the approach.
Conclusion
This article aims to provide a launching point in understanding that the mood of traders who create price charts through their trading decisions can be interpreted daily by reading candles. We recommend further reading on candlestick patterns before using them in your trading. It is also important to realise that each candle is completed after the close of the market. The candles are always historical, and what might happen tomorrow is pure speculation.
That said, candle patterns enhance the probability of a particular outcome the next trading day. At Market Alert Pro, we recommend backtesting candle patterns before deploying them in a trading strategy that uses real money. It is always good practice to paper trade a trading idea before risking real funds.
It is clear that each candle can be read stand-alone but that no candle occurs in isolation. It is always good practice to consider what a candle means by considering the candles around it. For instance, does a candle or candle pattern occur at the top of an uptrend or the bottom of a downtrend? We also recommend reading more about candle interpretations. Candlestick books by Steve Nison rate highly.

